- Data Continuum
- Posts
- 7 steps to go from Zero to Hero in Data Analytics
7 steps to go from Zero to Hero in Data Analytics
Data Science can help you even if you’re a farmer.
Sasi SB
July 05, 2024
Data Science Nugget 🧽
Imagine you’re a farmer.
You rely on the rain to grow your crops and have no other water resources to irrigate your fields.
Your fields are drying and you're trying to predict if it will rain or not to plan your crops accordingly.
You have historical data that includes variables like temperature, humidity, and previous instances of rain.
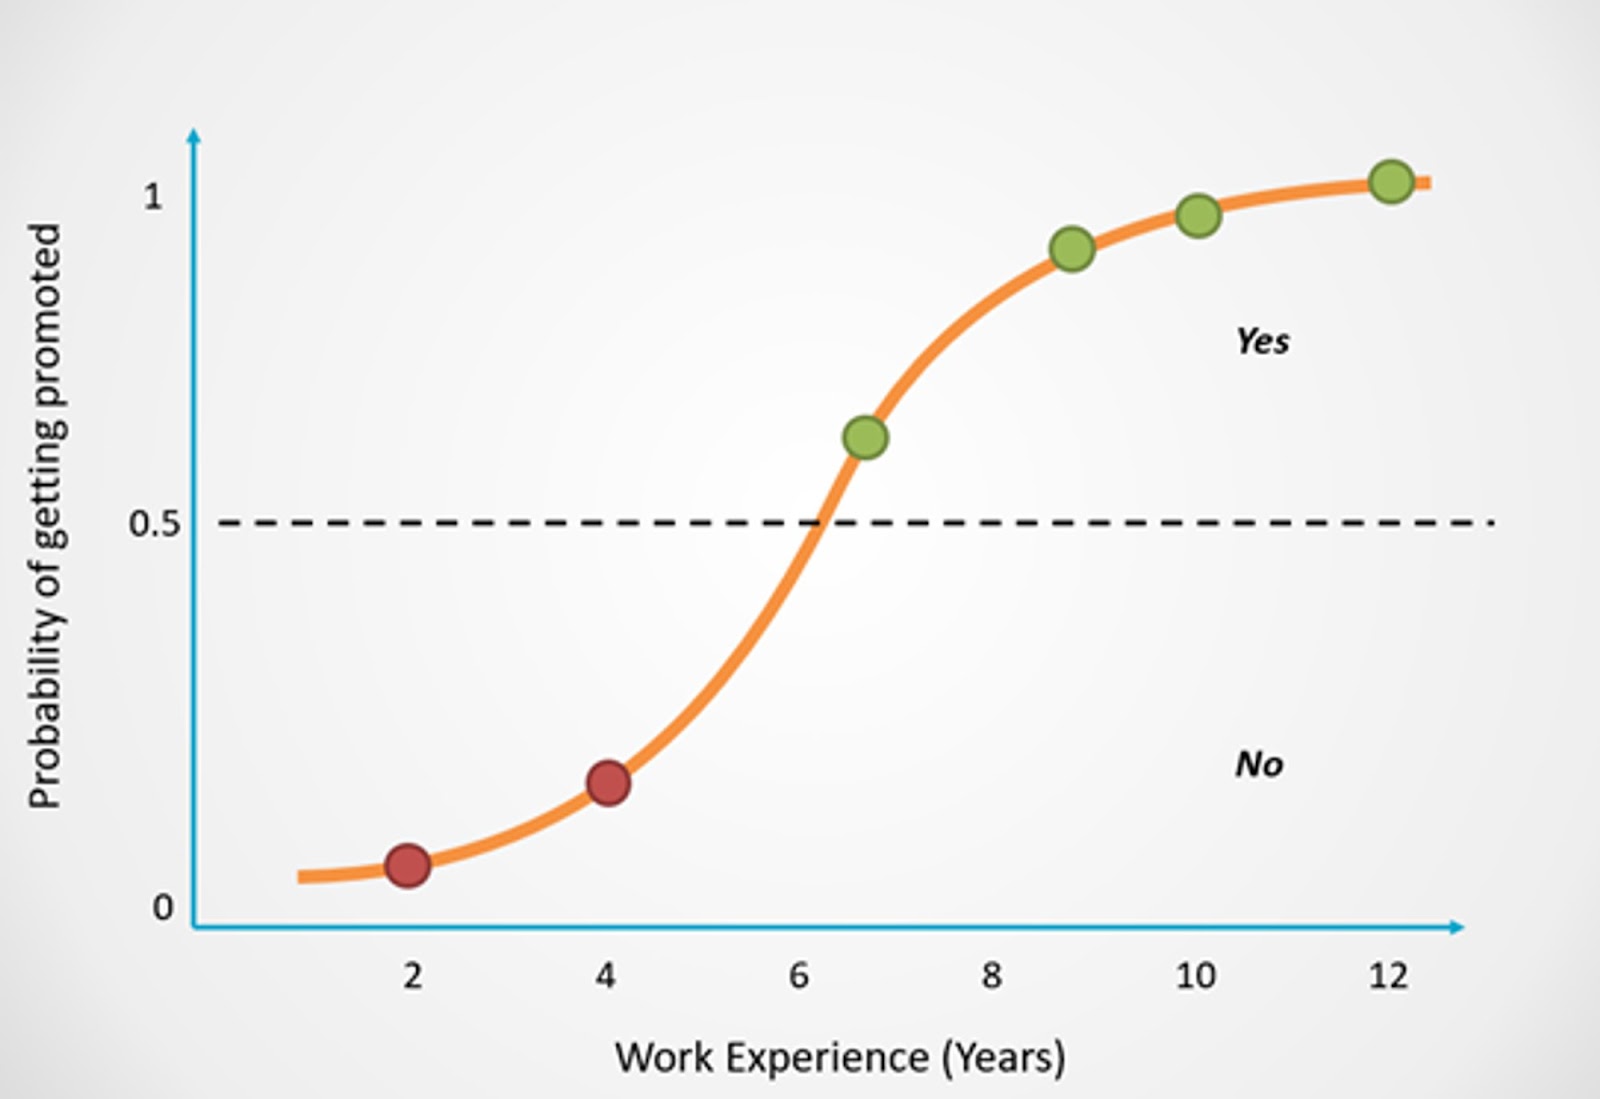
Logistic Regression is the statistical method that assists you in making this prediction.
It is specifically designed for binary outcomes, such as yes/no, 0/1, or, in this scenario, raining/not raining.
Here’s how it works:
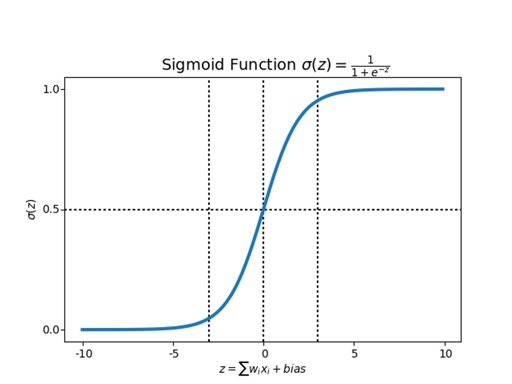
Sigmoid Function
Think of it as a way to squash any number between 0 and 1.
It's like making a probability. If the sigmoid function gives you 0.7, it means there's a 70% chance it will rain and your crops are safe!
Data and Weights:
You have your data (temperature, humidity) and some initial guesses called weights.
These weights indicate the importance of each factor in the prediction, starting with random values.
Combining and Squeezing:
The process involves multiplying each data point by its corresponding weight and summing these products. This sum is then passed through the sigmoid function, resulting in a probability.
For example, the model might output a 0.7 probability for rain, indicating a high likelihood.
Training:
Initially, your predictions may be inaccurate. By comparing the predicted probabilities with the actual outcomes (whether it rained or not), you can evaluate your model's accuracy.
This feedback allows you to adjust the weights to reduce prediction errors.
You repeat this process multiple times until your predictions become quite accurate.
Interesting Dataset for Practice 📊
This dataset contains historical daily prices for all tickers currently trading on NASDAQ.
Project Ideas:
1) Stock Performance Comparison
Choose 3-5 popular stocks from different sectors
Compare their performance over time using metrics like price change and returns
Visualize the results with line charts or bar graphs
2) Sector Analysis
Group stocks by sector using the metadata in symbols_valid_meta.csv
Calculate average returns and volatility for each sector
Identify which sectors performed best/worst over different time periods
3) Dividend Analysis for ETFs
Focus on the ETFs in the dataset
Calculate dividend yields using the adjusted close prices
Compare dividend performance across different ETF categories
Visualize dividend trends over time
Data Analysis Tool of the Week 🛠️
PygWalker is an open-source Python library that brings the functionality of Tableau-style data exploration to Jupyter notebooks.
It's designed to make exploratory data analysis (EDA) more intuitive and interactive, especially for those who are familiar with tools like Tableau but prefer working in a Python environment.
5 Key features of PygWalker:
Interactive visualizations.
Jupyter integration
No-code option
Customization
Performance
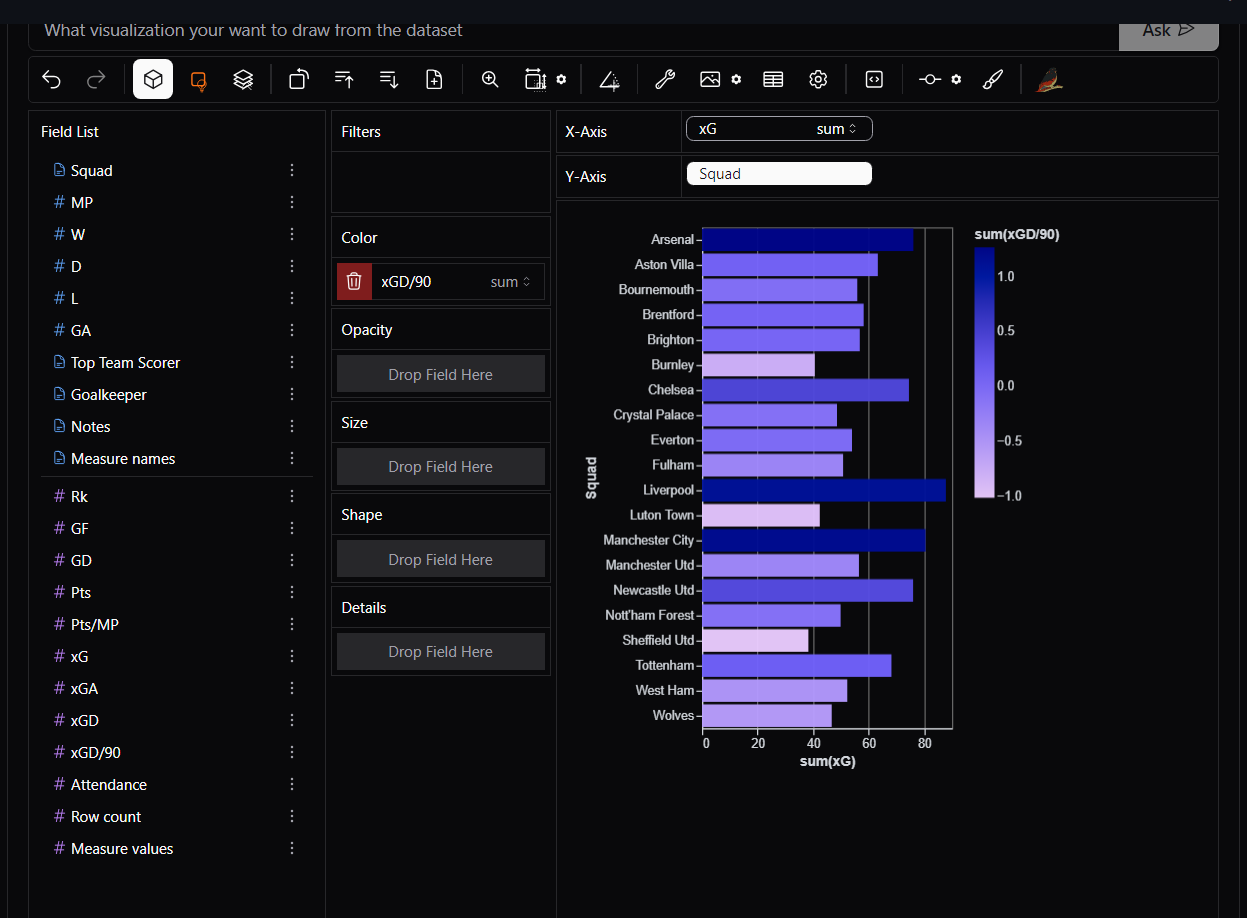
I built an app using Pygwalker.
Q&A Section 🙋
“How do you go from Zero to Hero in Data Analytics?”
If you’re just starting as a Data Analyst and want to become good at it…
Here are 7 simple steps that will help you go from Zero to Hero in Data Analytics:
Learn the Fundamentals: Stats, Probability, programming, Databases
Master the tools: Excel, SQL, Python, Power BI
Practice with real datasets and projects
Study ML basics
Develop domain knowledge
Relearn and keep upskilling
Network and keep looking out for opportunities
Let me tell you this beforehand.
This is SIMPLE, but not EASY.
Also, if you want to become an expert in the field of Data Analytics overnight, this is not for you.
Why?
Because rushing the process in the field of Data Analytics will become a roadblock for you in itself.
Keep the process slow and steady, and if you hit a roadblock, tweak your approach and keep pushing forward.
-Sasi
P.S. I'm working on something really exciting.
Something that will benefit many of you reading this newsletter.
I'll share more details in my next email.
Until then, stay tuned!
Reply