- Data Continuum
- Posts
- Hypothesis Testing, Deciding KPI and a Cool Dataset!
Hypothesis Testing, Deciding KPI and a Cool Dataset!
A cool tool to add to your arsenal as well!
Sasi SB
June 07, 2024

Data Science Nugget 🧽
Let’s look at the basics of Hypothesis Testing.
Hypothesis plays a crucial role in decision-making, whether it may be making business decisions, in the health sector, academia, or in quality improvement.
Without hypothesis & hypothesis tests, you risk drawing the wrong conclusions and making bad decisions
What is Hypothesis Testing?
Hypothesis testing is used to make informed decisions based on available evidence. It involves assessing the validity of a proposed hypothesis by evaluating sample data.
The process typically begins with formulating 2 distinct hypotheses:
Null Hypothesis (H0) - represents the absence of any significant effect or difference
Alternative Hypothesis (H1) - suggests the presence of a notable effect or difference
Example: A sanitizer manufacturer claims that its product kills 95 percent of germs on average. To put this company's claim to the test, create a null and alternate hypothesis.
H0 (Null Hypothesis): Average = 95%.
Alternative Hypothesis (H1): The average is less than 95%.
Subsequently, a relevant statistical test is used based on the nature of the data and the research question at hand.
Here are some of the prominent tests…
T-test
ANOVA(Analysis of Variance)
Chi-squared test
Regression analysis
This chosen test generates a test statistic, which quantifies the extent to which the observed data aligns with the expectations set by the null hypothesis.
By comparing the test statistic to a critical value or calculating a p-value, data scientists can make informed decisions about the hypotheses.
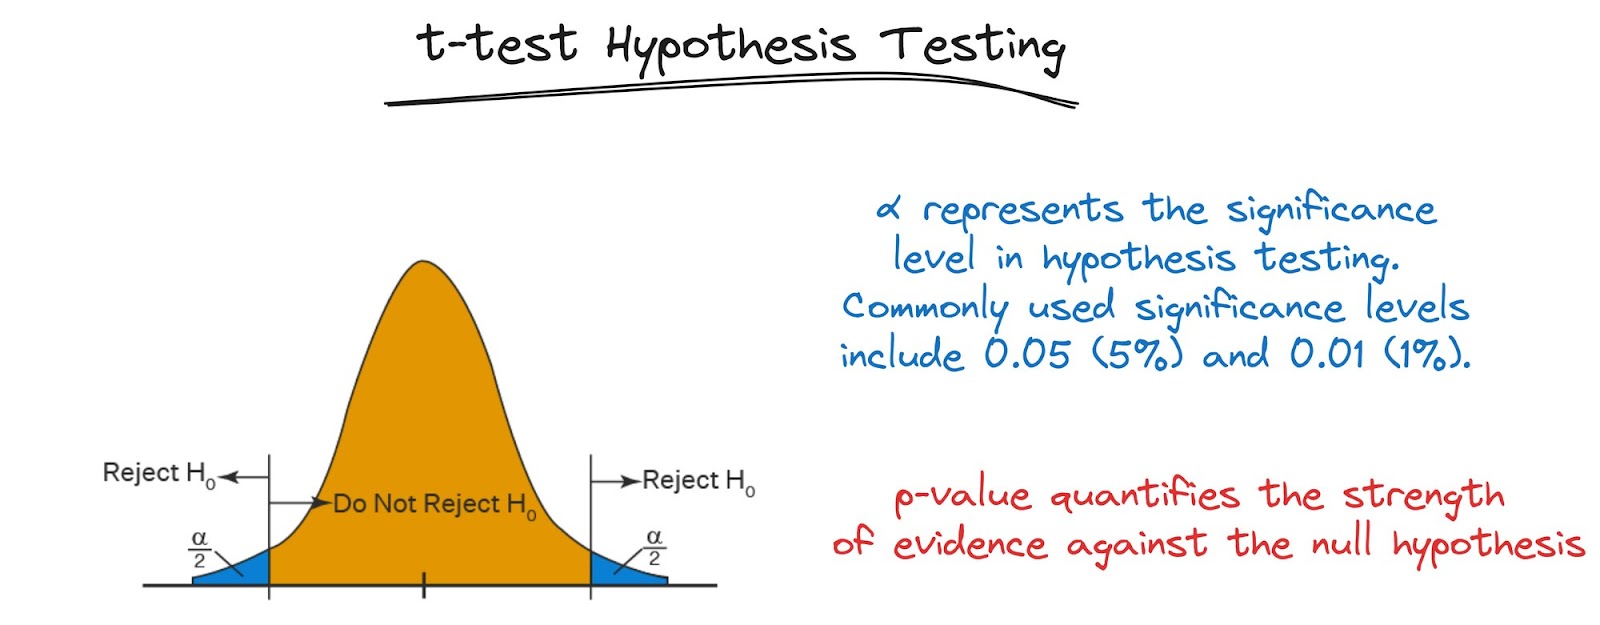
Now what is a P-value?
A p-value is a number that helps us decide if the results of an experiment are significant. It tells us how likely it is to get the results we did if the original assumption (null hypothesis) is true.
When the p-value is very small, it suggests that the original assumption is probably wrong, and we should consider other explanations.
Here’s a diagram to help you understand it better.
Interesting Dataset for Practice 📊
This is a dataset about distinguishing genuine and forged banknotes.
Project Ideas:
1) A simple classification model to predict genuine or forged.
2) Feature Importance Analysis to identify the strongest feature to predict genuine or forged
3) EDA - Visualization to understand the spread and structure of the dataset
Data Analysis Tool of the Week 🛠️
Klipfolio is yet another Data Visualization platform but with a twist.
Klipfolio is easier to set up and has a clean UI which sets the barrier for small companies to use data to get insights.
As a tool just know that Klipfolio exists and its low floor to entry is great for small companies to get started in Data.

This is a Klipfolio Dashboard. I have worked on many projects involving Klipfolio.
Q&A Section 🙋
A member of the Data Science Master Mind Group recently asked me:
"How to improve knowledge on deciding key metrics and analysis required for various dashboards"
In my opinion, it takes practice and experience to gain this knowledge on KPI selection and analysis required.
But the main focus should be on the Objective of the project.
At the start of the project, the companies have to determine what they want to achieve with their data.
Customer retention or marketing channel optimization whatever it is. Then assess where your data is present and what kind of data do you have. Then decide which KPI fulfills the requirements and achieves the objective.
It's a process that can be understood well with examples and projects.
Here is a video to get started: https://www.youtube.com/watch?v=zIwCtA3iU1I
Reply