- Data Continuum
- Posts
- KNN, Dashboard Mockup Tool, And More...
KNN, Dashboard Mockup Tool, And More...
"The dataset I found on Kaggle has not many variations when I visualized it.”
Sasi SB
June 16, 2024
Data Science Nugget 🧽
Imagine you moved into a new city and want to ask about the price of houses in that area.
You’d probably ask your neighbors for help, right?
Now, let’s connect this to Data Science.
KNN (K-Nearest Neighbor) works similarly.
When you need to make a prediction, KNN looks at the closest data points, like asking your neighbors for advice.
It's a supervised ML algorithm used for both classification and regression.
Here's how it works:
Data Points:
Imagine you live in a neighborhood with lots of houses.
Each house has different characteristics, like size, number of rooms, and location.
These houses are like data points in KNN.
Nearest Neighbors:
When you need to figure something out, like how expensive a house might be, KNN checks the houses closest to it.
Think of these close houses as your neighbors who are similar to the house you're interested in.
Majority Rules:
Suppose you want to know if a house in your neighborhood is expensive.
You ask your closest neighbors about their house prices.
If most of them say their houses are expensive, you would guess that the house you’re asking about is expensive too. If most say their houses are not expensive, you’d guess the same for the house in question.
Check out this diagram to have a better understanding of this.
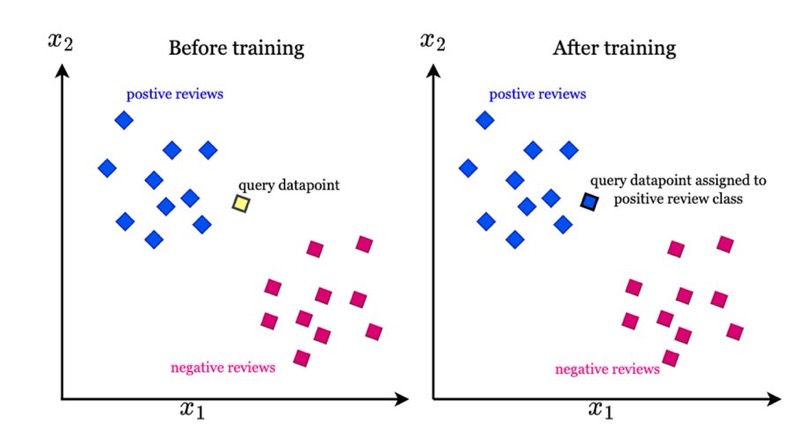
So, KNN is like asking your neighbors for advice when you’re trying to make a decision based on what’s common in your neighborhood.
Interesting Dataset for Practice 📊
This dataset provides daily updates on the volume of US job listings filtered by geography industry job family and role,
Project Ideas:
1) EDA - Visualization to understand the spread and structure of the dataset
2) Time series analysis - Forecasting the number of lay-offs in the coming months
Data Analysis Tool of the Week 🛠️
Mokkup.ai stands out as a powerful tool that simplifies the mockup creation process through the use of AI and a range of user-friendly features.
Its ability to save time, facilitate collaboration, and integrate with other design tools makes it an invaluable resource for anyone involved in web and mobile app design.
Whether you're looking to quickly generate prototypes or collaborate with your team, Mokkup.ai has the tools you need to bring your ideas to life efficiently and effectively.

Make Dashboard wireframe mockups for free
Q&A Section 🙋
A member asked me:
"The dataset I found on Kaggle has not many variations when I visualized it. Why is that?"
In my opinion, it depends on the source of the data in Kaggle.
Check for the data that were collected rather than synthesized.
Because usually the data which is synthesized don't have much variation.
Here are some sources to get data:
That’s it for today’s email.
Reply to this email with topics that you want to learn about in the future, so I can write a detailed email on those topics for you in the Q&A section of my upcoming emails.
Reply